Dear Class 12 Samacheer Kalvi students, here are the Text Book Solutions for Exercise 9.1 Business Maths Chapter 9 Applied Statistics for your reference and study.
You can find the links to the other exercises below.
Applied Statistics Important Formulas
Solutions for Applied Statistics Exercise 9.2
Solutions for Applied Statistics Exercise 9.3
Solutions for Applied Statistics Exercise 9.4
Applied Statistics Exercise 9.1


| Year | Quarterly Production | |||
|---|---|---|---|---|
| I | II | III | IV | |
| 2002 | 3.5 | 3.8 | 3.7 | 3.5 |
| 2003 | 3.6 | 4.2 | 3.4 | 4.1 |
| 2004 | 3.4 | 3.9 | 3.7 | 4.2 |
| 2005 | 4.2 | 4.5 | 3.8 | 4.4 |
| 2006 | 3.9 | 4.4 | 4.2 | 4.6 |
| Year | Quarterly Production | |||
|---|---|---|---|---|
| I | II | III | IV | |
| 2002 | 3.5 | 3.8 | 3.7 | 3.5 |
| 2003 | 3.6 | 4.2 | 3.4 | 4.1 |
| 2004 | 3.4 | 3.9 | 3.7 | 4.2 |
| 2005 | 4.2 | 4.5 | 3.8 | 4.4 |
| 2006 | 3.9 | 4.4 | 4.2 | 4.6 |
| Quarterly Total | 18.6 | 20.8 | 18.8 | 20.8 |
| Quarterly Average | 3.72 | 4.16 | 3.76 | 4.16 |


| Year | 1986 | 1987 | 1988 | 1989 | 1990 | 1991 | 1992 | 1993 |
| Profit (in Rs.) | 15420 | 15470 | 15520 | 21020 | 26500 | 31950 | 35600 | 34900 |

| Year | Profit | 3-yearly moving totals | 3-yearly moving averages |
|---|---|---|---|
| 1986 | 15420 | - | - |
| 1987 | 15470 | 46410 | 15470 |
| 1988 | 15520 | 52010 | 17336.67 |
| 1989 | 21020 | 63040 | 21013.33 |
| 1990 | 26500 | 79470 | 26490 |
| 1991 | 31950 | 94050 | 31350 |
| 1992 | 35600 | 102450 | 34150 |
| 1993 | 34900 | - | - |


| Year | 1979 | 1980 | 1981 | 1982 | 1983 | 1984 |
| Production(in '000s) | 126 | 123 | 117 | 128 | 125 | 124 |
| Year | 1985 | 1986 | 1987 | 1988 | 1989 | 1990 |
| Production(in '000s) | 130 | 114 | 122 | 129 | 118 | 123 |
| Year | Production (in '000s) | 5-yearly moving total | 5-yearly moving averages |
|---|---|---|---|
| 1979 | 126 | - | - |
| 1980 | 123 | - | - |
| 1981 | 117 | 619 | 123.8 |
| 1982 | 128 | 617 | 123.4 |
| 1983 | 125 | 624 | 124.8 |
| 1984 | 124 | 621 | 124.2 |
| 1985 | 130 | 615 | 123 |
| 1986 | 114 | 619 | 123.8 |
| 1987 | 122 | 613 | 122.6 |
| 1988 | 129 | 606 | 121.2 |
| 1989 | 118 | - | - |
| 1990 | 123 | - | - |


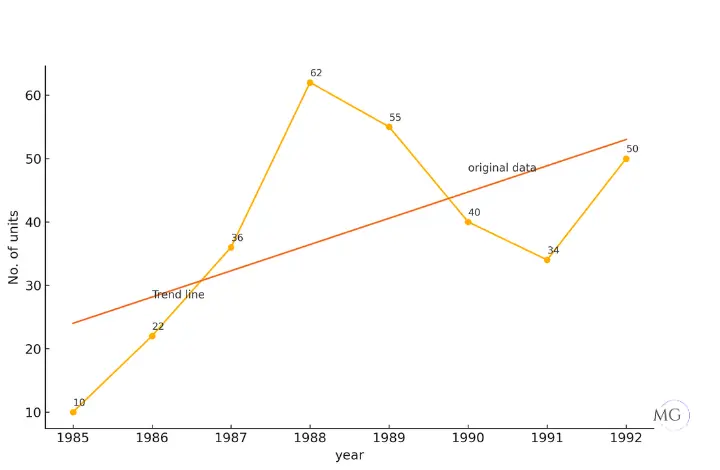
| Year | 1985 | 1986 | 1987 | 1988 | 1989 | 1990 | 1991 | 1992 |
| No. of units(in '000s) | 10 | 22 | 36 | 62 | 55 | 40 | 34 | 50 |

| Year | 1995 | 1996 | 1997 | 1998 | 1999 | 2000 | 2001 |
| Production(in tons) | 155 | 162 | 171 | 182 | 158 | 180 | 178 |

| Year (x) | Production (Y) | X=x-A (1998) | X2 | XY | Trend Values |
|---|---|---|---|---|---|
| 1995 | 155 | -3 | 9 | -465 | 159.56 |
| 1996 | 162 | -2 | 4 | -324 | 162.85 |
| 1997 | 171 | -1 | 1 | -171 | 166.14 |
| 1998 | 182 | 0 | 0 | 0 | 169.43 |
| 1999 | 158 | 1 | 1 | 158 | 172.72 |
| 2000 | 180 | 2 | 4 | 360 | 176.01 |
| 2001 | 178 | 3 | 9 | 534 | 179.3 |
| n=7 | ΣY=1186 | ΣX=0 | ΣX2=28 | ΣXY=92 |


| Year | 2000 | 2001 | 2002 | 2003 | 2004 |
| Sales(in '000s) | 35 | 36 | 79 | 80 | 40 |

| Year (x) | Sales (Y) | X=x-A (2002) | X2 | XY | Trend Values |
|---|---|---|---|---|---|
| 2000 | 35 | -2 | 4 | -70 | 43.2 |
| 2001 | 36 | -1 | 1 | -36 | 48.6 |
| 2002 | 79 | 0 | 0 | 0 | 54 |
| 2003 | 80 | 1 | 1 | 80 | 59.4 |
| 2004 | 40 | 2 | 4 | 80 | 64.8 |
| n=5 | ΣY=270 | ΣX=0 | ΣX2=10 | ΣXY=54 |


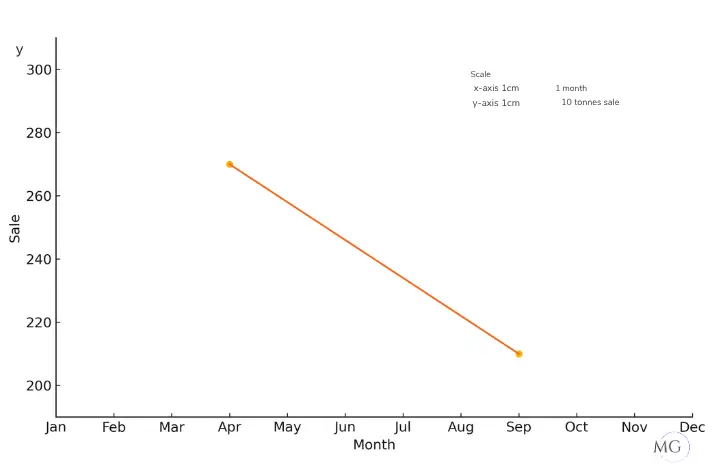
| In Year 2010 | Jan | Feb | Mar | Apr | May | June |
| Sales(in tons) | 280 | 240 | 270 | 300 | 280 | 290 |
| In Year 2010 | July | Aug | Sept | Oct | Nov | Dec |
| Sales(in tons) | 210 | 200 | 230 | 200 | 230 | 210 |

| Month | Sale | Average |
|---|---|---|
| Jan | 280 | |
| Feb | 240 | |
| Mar | 270 | 280+240+270+300+280+290/6=276.67 |
| Apr | 300 | |
| May | 280 | |
| Jun | 290 | |
| Jul | 210 | |
| Aug | 200 | |
| Sep | 230 | |
| Oct | 200 | 210+200+230+200+230+210/6=213.33 |
| Nov | 230 | |
| Dec | 210 |


| Quarter I | Quarter II | Quarter III | Quarter IV | |
|---|---|---|---|---|
| 2008 | 72 | 68 | 62 | 76 |
| 2009 | 78 | 74 | 78 | 72 |
| 2010 | 74 | 70 | 72 | 76 |
| 2011 | 76 | 74 | 74 | 72 |
| 2012 | 72 | 72 | 76 | 68 |
| Quarter I | Quarter II | Quarter III | Quarter IV | |
|---|---|---|---|---|
| 2008 | 72 | 68 | 62 | 76 |
| 2009 | 78 | 74 | 78 | 72 |
| 2010 | 74 | 70 | 72 | 76 |
| 2011 | 76 | 74 | 74 | 72 |
| 2012 | 72 | 72 | 76 | 68 |
| Quarterly Total | 372 | 358 | 362 | 364 |
| Quarterly Average | 74.4 | 71.6 | 72.4 | 72.8 |


| Year | 1992 | 1993 | 1994 | 1995 | 1996 |
|---|---|---|---|---|---|
| No. of salesmen | 46 | 48 | 42 | 56 | 52 |


| Year (x) | Sales (Y) | X=x-A (2002) | X2 | XY | Trend Values |
|---|---|---|---|---|---|
| 1992 | 46 | -2 | 4 | -92 | 44.8 |
| 1993 | 48 | -1 | 1 | -48 | 46.8 |
| 1994 | 42 | 0 | 0 | 0 | 48.8 |
| 1995 | 56 | 1 | 1 | 56 | 50.8 |
| 1996 | 52 | 2 | 4 | 104 | 52.8 |
| n=5 | ΣY=244 | ΣX=0 | ΣX2=10 | ΣXY=20 |


Leave a Reply