Dear Class 12 Samacheer Kalvi students, here are the Economics, Chapter 12 Introduction to Statistical Methods and Econometrics text book solutions for your reference and study. If you have any doubts in the topic, please reach out to us in the comments section.
Part – A Multiple choice questions
| 1. The word ‘statistics’ is used as __________. | |
| (a) Singular | |
| (b) Plural | |
| (c) Singular and Plural | |
| (d) None of above | |
| 2. Who stated that statistics as a science of estimates and probabilities | |
| (a) Horace Secrist | |
| (b) R.A Fisher | |
| (c) Ya-Lun-Chou | |
| (d) Boddington | |
| 3. Sources of secondary data are ___________. | |
| (a) Published sources | |
| (b) Unpublished sources | |
| (c) neither published nor unpublished sources | |
| (d) Both (A) and (B) | |
| 4. The data collected by questionnaires are_____________. | |
| (a) Primary data | |
| (b) Secondary data | |
| (c) Published data | |
| (d) Grouped data | |
| 5. A measure of the strength of the linear relationship that exists between two variables is called: | |
| (a) Slope | |
| (b) Intercept | |
| (c) Correlation coefficient | |
| (d) Regression equation | |
| 6. If both variables X and Y increase or decrease simultaneously, then the coefficient of correlation will be: | |
| (a) Positive | |
| (b) Negative | |
| (c) Zero | |
| (d) One | |
| 7. If the points on the scatter diagram indicate that as one variable increases the other variable tends to decrease the value of r will be: | |
| (a) Perfect positive | |
| (b) Perfect negative | |
| (c) Negative | |
| (d) Zero | |
| 8. The value of the coefficient of correlation r lies between: | |
| (a) 0 and 1 | |
| (b) -1 and 0 | |
| (c) -1 and +1 | |
| (d) -0.5 and +0.5 | |
| 9. The term regression was used by: | |
| (a) Newton | |
| (b) Pearson | |
| (c) Spearman | |
| (d) Galton | |
| 10. The purpose of simple linear regression analysis is to: | |
| (a) Predict one variable from another variable | |
| (b) Replace points on a scatter diagram by a straight-line | |
| (c) Measure the degree to which two variables are linearly associated | |
| (d) Obtain the expected value of the independent random variable for a given value of the dependent variable | |
| 11. A process by which we estimate the value of dependent variable on the basis of one or more independent variables is called: | |
| (a) Correlation | |
| (b) Regression | |
| (c) Residual | |
| (d) Slope | |
| 12. If Y = 2 - 0.2X, then the value of Y intercept is equal to | |
| (a) -0.2 | |
| (b) 2 | |
| (c) 0.2X | |
| (d) All of the above | |
| 13. In the regression equation Y = β0+β1X, the Y is called: | |
| (a) Independent variable | |
| (b) Dependent variable | |
| (c) Continuous variable | |
| (d) none of the above | |
| 14. In the regression equation Y = β0+β1X, the X is called: | |
| (a) Independent variable | |
| (b) Dependent variable | |
| (c) Continuous variable | |
| (d) none of the above | |
| 15. Econometrics is the integration of | |
| (a)Economics and Statistics | |
| (b) Economics and Mathematics | |
| (c) Economics, Mathematics and Statistics | |
| (d) None of the above | |
| 16 . Econometric is the word coined by | |
| (a) Francis Galton | |
| (b) RagnarFrish | |
| (c) Karl Person | |
| (d) Spearsman | |
| 17. The raw materials of Econometrics are: | |
| (a) Data | |
| (b) Goods | |
| (c) Statistics | |
| (d) Mathematics | |
| 18. The term Uiin regression equation is | |
| (a) Residuals | |
| (b) Standard error | |
| (c) Stochastic error term | |
| (d) none | |
| 19. The term Uiis introduced for the representation of | |
| (a) Omitted Variable | |
| (b) Standard error | |
| (c) Bias | |
| (d) Discrete Variable | |
| 20. Econometrics is the amalgamation of | |
| (a) 3 subjects | |
| (b) 4 subjects | |
| (c) 2 subjects | |
| (d) 5 subjects |
Part-B Answer the following in one or two sentences
21. What is Statistics?
Answer: Statistics may be defined as the collection, organisation, presentation, analysis and interpretation of numerical data – Croxton & Cowden
22. What are the kinds of Statistics?
Answer: There are two major types of statistics named as Descriptive Statistics and Inferential Statistics.
The branch of statistics devoted to the summarization and description of data is called Descriptive Statistics.
The branch of statistics concerned with using sample data to make an inference about a population of data is called Inferential Statistics.
23. What do you mean by Inferential Statistics?
Answer: The branch of statistics concerned with using sample data to make an inference about a population of data is called Inferential Statistics.
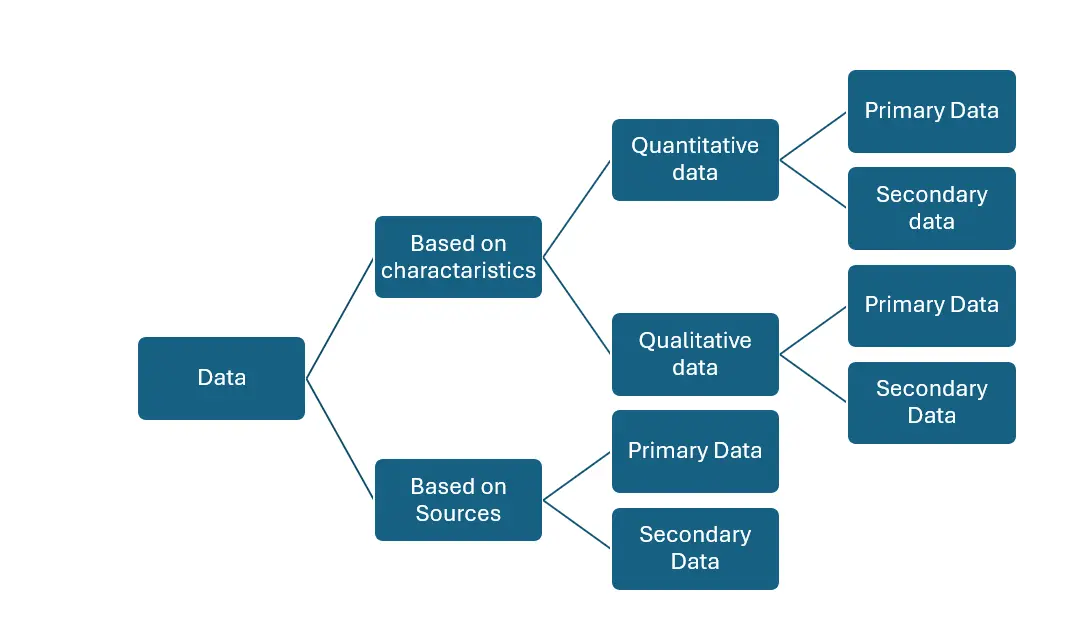
24. What are the kinds of data?
Answer:
25. Define Correlation.
Answer: Correlation is the relationship between two or more variables, which vary with the other in the same or the opposite direction.
26. Define Regression.
Answer: Regression is a mathematical measure showing the average relationship between two variables. Regression means “Stepping back towards the average”.
27. What is Econometrics?
Answer: The term econometrics is formed from two words of Greek origin, ‘oukovouia’ meaning economy and ‘uetpov’ meaning measure. It may be considered as the integration of economics, Statistics and Mathematics. Econometrics means economic measurement and it deals with the measurement of economic relationships.
Part-C – Answer the following questions in one paragraph:
28. What are the functions of Statistics?
Answer: The functions of statistics are as follows:
- Statistics presents facts in a definite form.
- It simplifies mass of figures.
- It facilitates comparison.
- It helps in formulating and testing.
- It helps in prediction.
- It helps in the formulation of suitable policies.
29. Find the Standard Deviation of the following data:
14, 22, 9, 15, 20, 17, 12, 11
Answer:
| S. No | X | (x-̅x) | (x-̅x)2 |
| 1 | 14 | -1 | 1 |
| 2 | 22 | 7 | 49 |
| 3 | 9 | -6 | 36 |
| 4 | 15 | 0 | 0 |
| 5 | 20 | 5 | 25 |
| 6 | 17 | 2 | 4 |
| 7 | 12 | -3 | 9 |
| 8 | 11 | -4 | 16 |
| N=8 | ∑X=120 | 0 | ∑(x-̅x)2 =140 |


30. State and explain the different kinds of Correlation.
Answer: The different kinds of Correlation are:
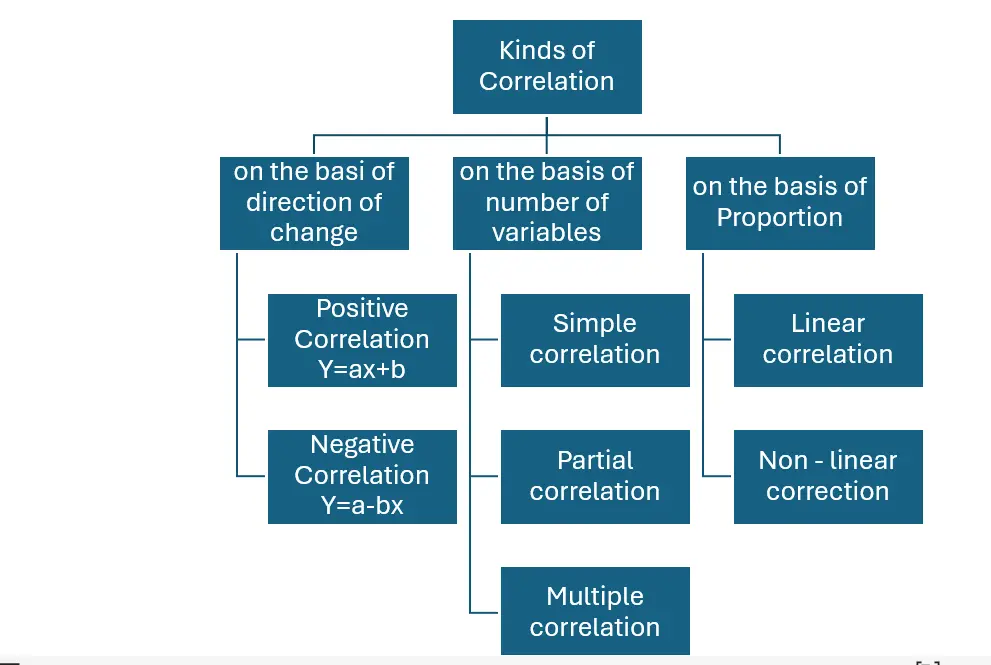
Positive Correlation: The correlation is said to be positive if the values of two variables move in the same direction. Ex. Y= a + bx
Negative Correlation: The Correlation is said to be negative when the values of variables move in the opposite directions. Ex. Y= a – bx.
Simple Correlation: If only two variables are taken for study then it is said to be simple correlation. Ex. Y= a + bx
Multiple Correlations: If three or more than three variables are studied simultaneously, then it is termed as multiple correlation. Ex :Qd= f (P, Pc, Ps, t, y)
Partial Correlation: If there are more than two variables but only two variables are considered keeping the other variables constant, then the correlation is said to be Partial Correlation.
Linear Correlation: Correlation is said to be linear when the amount of change in one variable tends to bear a constant ratio to the amount of change in the other. Ex. Y= a + bx
Non Linear: The correlation would be non-linear if the amount of change in one variable does not bear a constant ratio to the amount of change in the other variables. Ex. Y= a + bx2
31. Mention the uses of Regression Analysis.
Answer: The uses of Regression Analysis are:
- It indicates the cause and effect relationship between the variables and establishes functional relationship.
- Besides verification it is used for the prediction of one value, in relation to the other given value.
- Regression coefficient is an absolute figure. If we know the value of the independent variable, we can find the value of the dependent variable.
- It has wider application, as it studies linear and nonlinear relationship between the variables.
- It is widely used for further mathematical treatment
32. Specify the objectives of econometrics.
Answer: The objectives of econometrics are:
General objective: The general objective of Econometrics is to give empirical content to economic theory.
Specific objectives:
1. It helps to explain the behaviour of a forthcoming period that is forecasting economic phenomena.
2. It helps to prove the old and established relationships among the variables or between the variables.
3. It helps to establish new theories and new relationships.
4. It helps to test the hypotheses and estimation of the parameter.
33. Differentiate the economic model with econometric model.
Answer:
| Economic model | Econometric model |
| Models in Mathematical Economics are developed based on Economic Theories. | Econometric Models are developed based on Economic Theories to test the validity of Economic Theories in reality through the actual data. |
| Regression Analysis in Statistics does not concentrate more on error terms. | Econometric Models concentrate more on error terms. |
| Statistics Regression: Yi = β0 + β 1X 1 | Econometrics Regression: Yi = β 1 + β 1 X 1 + U 1 With more than 2 variables Yi = β 0 + β1 X1 + B2 X 2 + B3 X3 + U 1 Systematic Part: β0 + β1 X1 or explained part and Random Part: Ui unexplained part in a regression. Ui represents the role of omitted variables in specifying a regression relationship of Y on X. Hence, the Ui cannot and should not be ignored. |
34. Discuss the important statistical organizations (offices) in India.
Answer: The Statistics Wing called the National Statistical Office (NSO) consists of the Central Statistical Office (CSO), the Computer Centre and the National Sample Survey Office (NSSO).
Central Statistical Office:
It is responsible for co-ordination of statistical activities in the country and for evolving and maintaining statistical standards.
National Sample Survey Organisation:
The NSSO also known as National Sample Survey Office, is an organization under the Ministry of Statistic of the Government of India.
It is the largest organisation in India, conducting regular socio-economic surveys. It was established in 1950. NSSO has four divisions:
1. Survey Design and Research Division (SDRD)
2. Field Operations Division (FOD)
3. Data Processing Division (DPD)
4. Co-ordination and Publication Division (CPD)
Part-D – Answer the following questions
35. Elucidate the nature and scope of Statistics.
Answer:
Definition: Statistics may be defined as the collection, organisation, presentation, analysis and interpretation of numerical data – Croxton & Cowden
Nature: Tipett considers Statistics both as a science as well as an art.
Scope: Statistics is applied in every sphere of human activity.
Statistics and Economics:
Statistical data and techniques are useful in solving many economic problems such as fluctuation in wages, prices, production, distribution of income and wealth and so on.
Statistics and Firms
Statistics is widely used in many firms to find whether the product is conforming to specifications or not.
Statistics and Commerce
Statistics is the life blood of successful commerce. Market survey plays an important role to exhibit the present conditions and to forecast the likely changes in future.
Statistics and Education
Statistics is necessary for the formulation of policies to start new courses, according to the changing environment. There are many educational institutions engaged in research and development work to test the past knowledge and evolve new knowledge. These are possible only through statistics.
Statistics and Planning:
Statistics is indispensable in planning. In the modern world, almost all government organisations are seeking the help of planning for efficient working, for formulation of policy decisions and execution of the same. To achieve the above goals, various advanced statistical techniques are used for processing, analyzing and interpreting data.
Statistics and Medicine
In Medical sciences, to test the efficacy of a new drug or to compare the efficacy of two drugs or two medicines, t- test for the two samples is used. More and more statistical applications are at present used in clinical investigations.
Statistics and Modern applications
Recent developments in the fields of computer and information technology have enabled statistics to integrate their models and thus make statistics a part of decision making procedures of many organisations. There are many software packages available for solving simulation problems.
36. Calculate the Karl Pearson’s Correlation Co-efficient for the following data
| X | 23 | 27 | 28 | 29 | 30 | 31 | 33 | 35 | 36 | 39 |
| Y | 18 | 22 | 23 | 24 | 25 | 26 | 28 | 29 | 30 | 32 |
Answer:
Let A =30 B= 26; dx = X- A; dy= Y-B
| X | Y | dx | dy | d2 x | d2 y | dxdy |
| 23 | 18 | -7 | -8 | 49 | 64 | 56 |
| 27 | 22 | -3 | -4 | 9 | 16 | 12 |
| 28 | 23 | -2 | -3 | 4 | 9 | 6 |
| 29 | 24 | -1 | -2 | 1 | 4 | 2 |
| 30 | 25 | 0 | -1 | 0 | 1 | 0 |
| 31 | 26 | 1 | 0 | 1 | 0 | 0 |
| 33 | 28 | 3 | 2 | 9 | 4 | 6 |
| 35 | 29 | 5 | 3 | 25 | 9 | 15 |
| 36 | 30 | 6 | 4 | 36 | 16 | 24 |
| 39 | 32 | 9 | 6 | 81 | 36 | 54 |
| Total | ∑dx=11 | ∑dy= -3 | ∑d2 x= 275 | ∑d2 y= 159 | ∑dxdy 175 |
Karl Pearson’s Correlation Co-efficient =


37.Find the regression equation Y on X and X on Y for the following data:
| X | 45 | 48 | 50 | 55 | 65 | 70 | 75 | 72 | 80 | 85 |
| Y | 25 | 30 | 35 | 30 | 40 | 50 | 45 | 55 | 60 | 65 |
Answer: Please note in this problem, column 1 values are Y and column 2 values are X.
| Y | X | y= Y-65 | x=X-45 | y 2 | x 2 | xy |
| 45 | 25 | -20 | -20 | 400 | 400 | 400 |
| 48 | 30 | -17 | -15 | 289 | 225 | 255 |
| 50 | 35 | -15 | -10 | 225 | 100 | 150 |
| 55 | 30 | -10 | -15 | 100 | 225 | 150 |
| 65 | 40 | 0 | -5 | 0 | 25 | 0 |
| 70 | 50 | 5 | 5 | 25 | 25 | 25 |
| 75 | 45 | 10 | 0 | 100 | 0 | 0 |
| 72 | 55 | 7 | 10 | 49 | 25 | 70 |
| 80 | 60 | 15 | 15 | 225 | 225 | 225 |
| 85 | 65 | 20 | 20 | 400 | 400 | 400 |
| ∑X=645 | ∑Y=435 | ∑ y =-5 | ∑ x=-15 | ∑ y2 =1813 | ∑x2 =1725 | ∑xy1675 |


Regression Equation of X on Y


Regression Equation of Y on X


38. Describe the application of Econometrics in Economics.
Answer: The application of econometrics in economics includes:
Testing Theories and Relationships:
Economists develop theories about how different factors influence economic outcomes. Econometrics allows them to test these theories using real-world data. For instance, the theory might suggest that higher income leads to increased consumption. Econometric analysis can confirm this by measuring the strength of the relationship between income and consumption data.
Forecasting Economic Trends:
Econometric models can be used to forecast future economic trends. By analyzing historical data and relationships between variables, economists can build models to predict things like inflation, unemployment rates, or market movements. These forecasts are crucial for businesses and policymakers to make informed decisions.
Developing Economic Policy:
Econometrics helps evaluate the effectiveness of economic policies. By analyzing past data on how the economy responded to similar policies, economists can predict the potential impact of new policies. This helps policymakers make data-driven decisions for areas like taxation, interest rates, or welfare programs.
Examples of Econometrics in Action:
Labour Economics: Examining how factors like education, minimum wage, and skillsets affect employment and wages.
Macroeconomics: Forecasting economic growth, inflation, and the impact of government spending on these factors.
Financial Economics: Building models to assess risk, predict stock prices, and evaluate the effectiveness of investment strategies.
Econometrics is a powerful tool that helps economists move beyond theory and into the realm of practical applications. It allows them to analyze data, test hypotheses, and ultimately make more informed decisions about the economy.
Leave a Reply